Activity log
Review recorded tool calls, their outcomes, and detected sensitive-data patterns.
 MCPProxyGet MCPProxy ↗
Features / Activity & interfaces
Inspect routed tool activity and manage your servers through the Web UI, CLI, or macOS menu bar.
Why it matters
When a tool call fails or returns something surprising, a chat transcript is only part of the story. Inspect the proxy’s activity and server state.
Review recorded tool calls, their outcomes, and detected sensitive-data patterns.
Manage your proxy from the embedded browser interface.
Get a quick look at server status and access management from the menu bar.
Inspect activity and server state from the terminal and scripts.
An example workflow
Visibility covers traffic routed through MCPProxy. Direct client connections and other agent actions are outside that record; recorded detail depends on configuration.
Explore the rest of your setup
Inside MCPProxy
Actual local UI captures · September 11, 2026. Charts include demonstration traffic, not adoption metrics. Open either theme at full size.
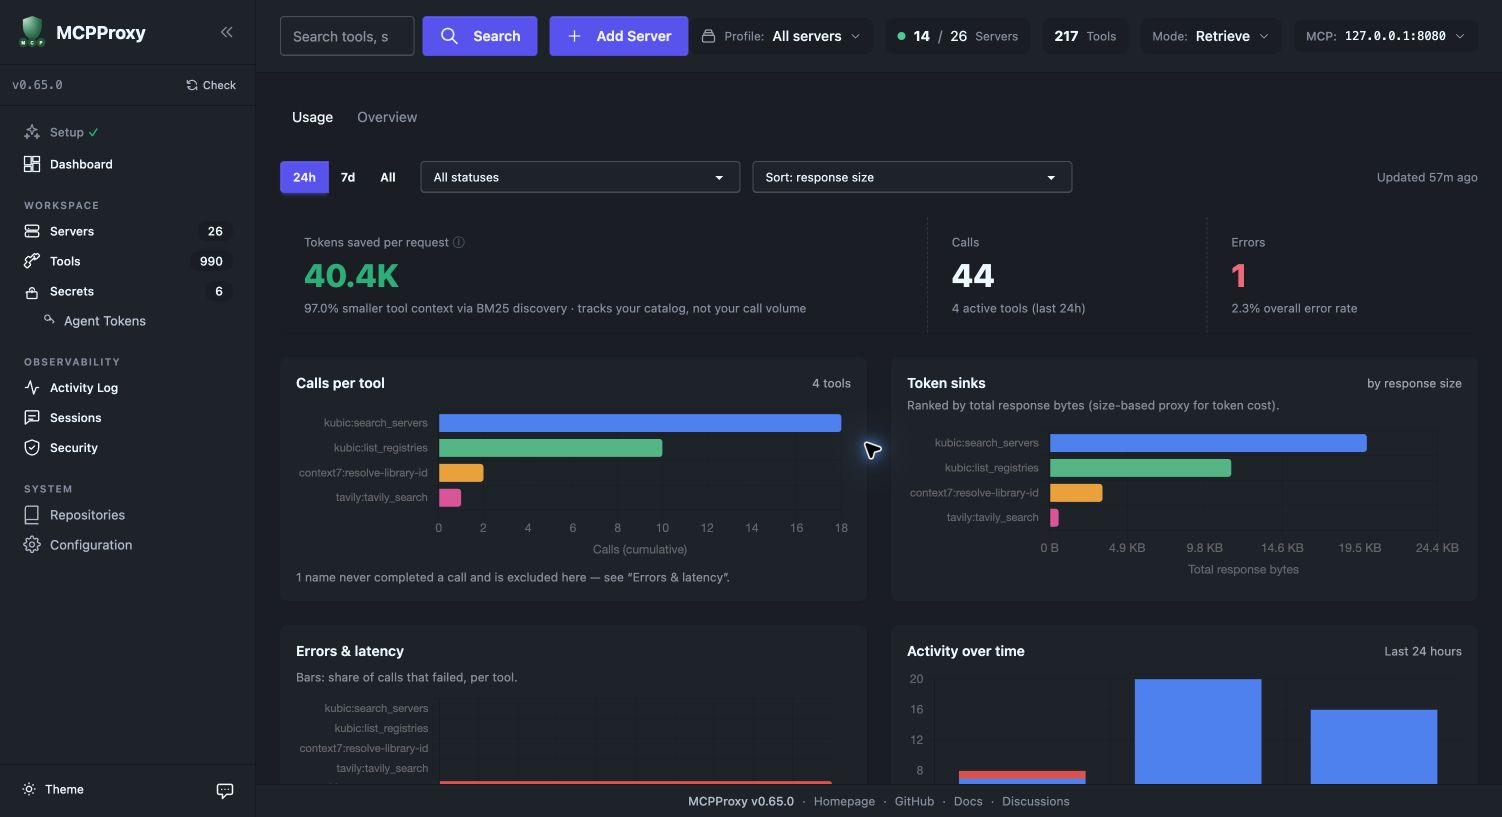
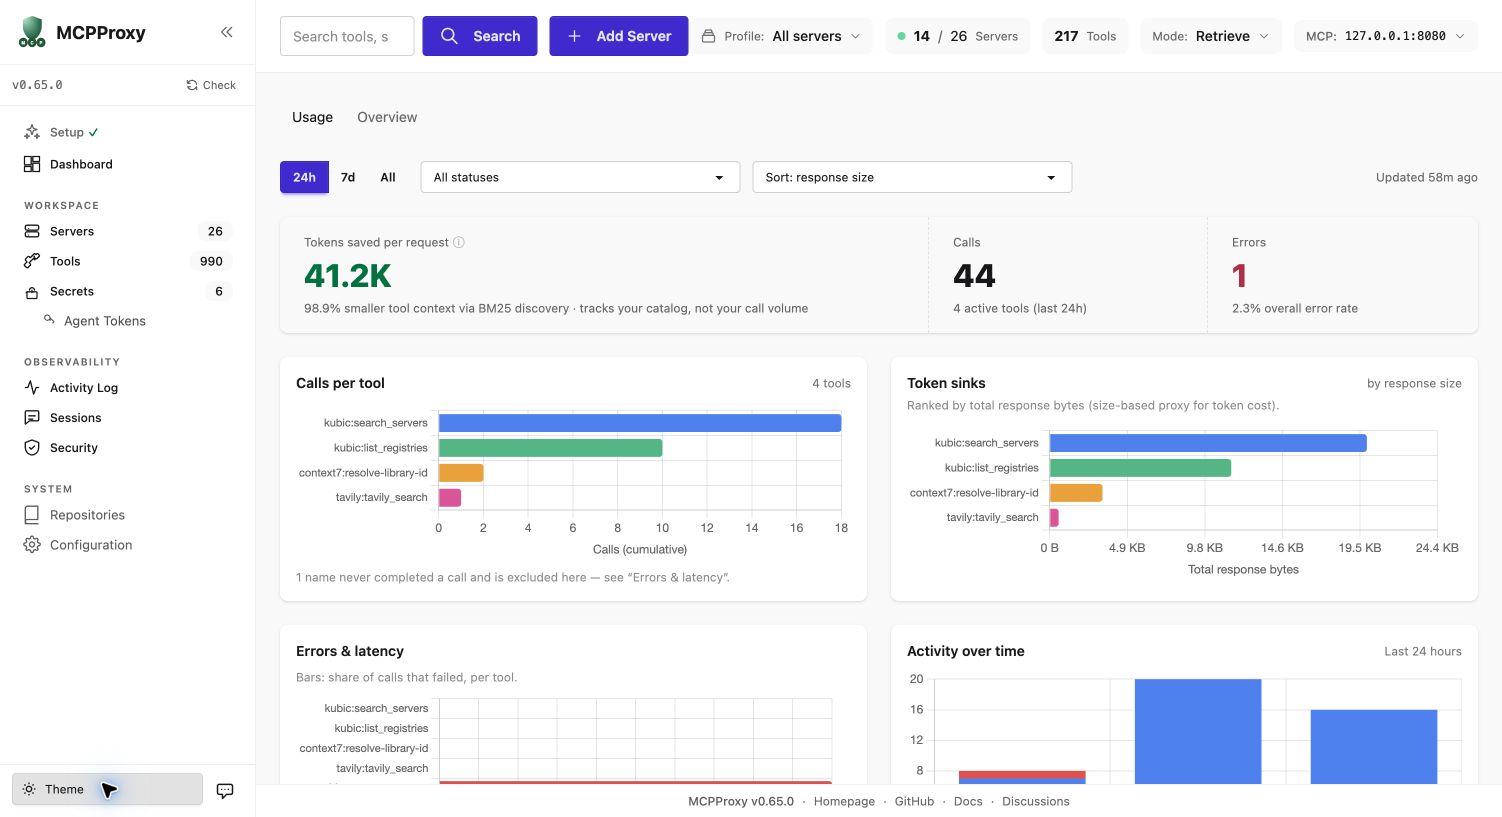
Call counts, response sizes and activity charts from a running local proxy.
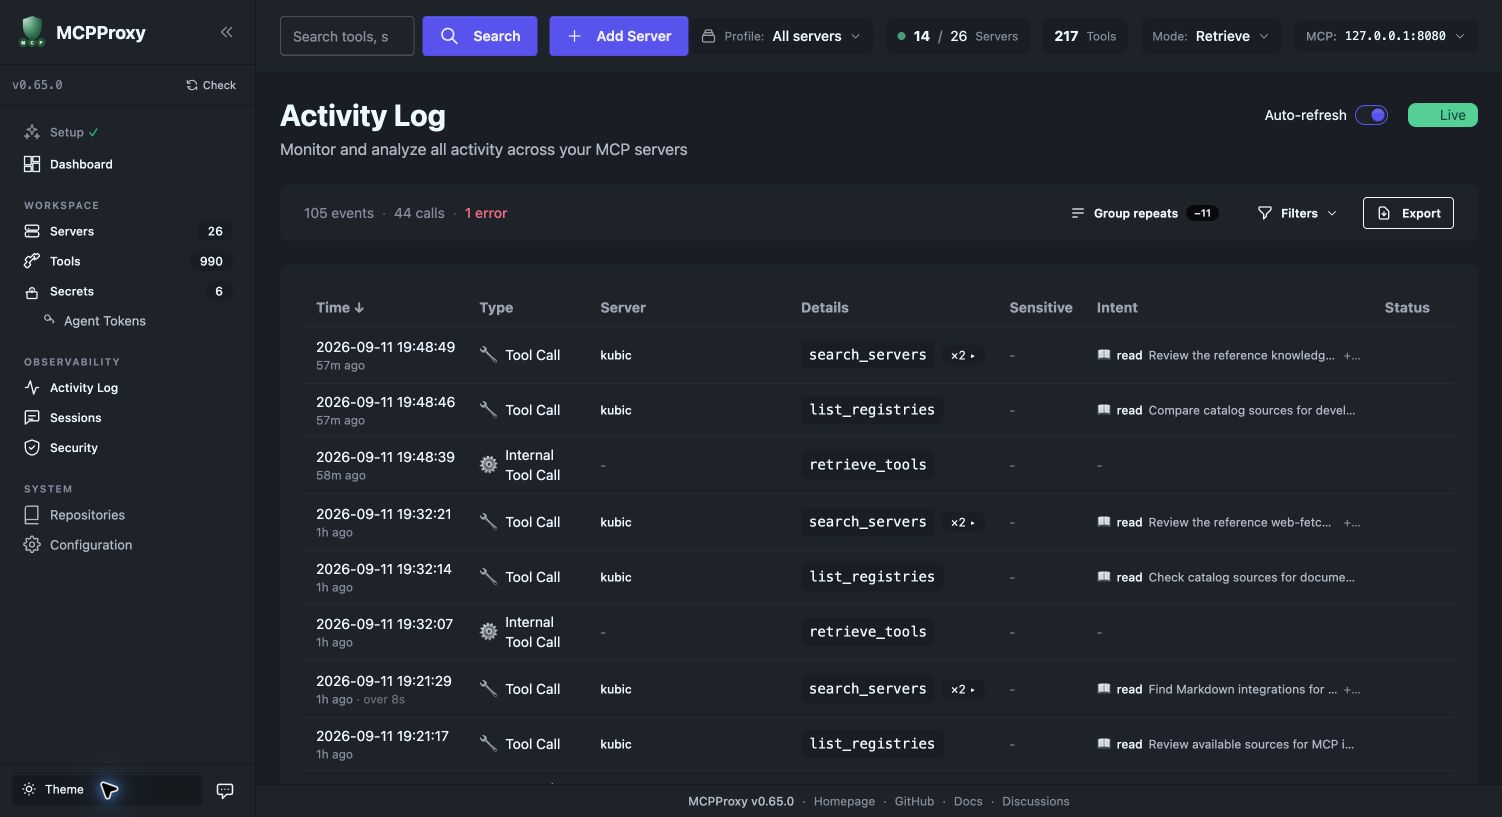
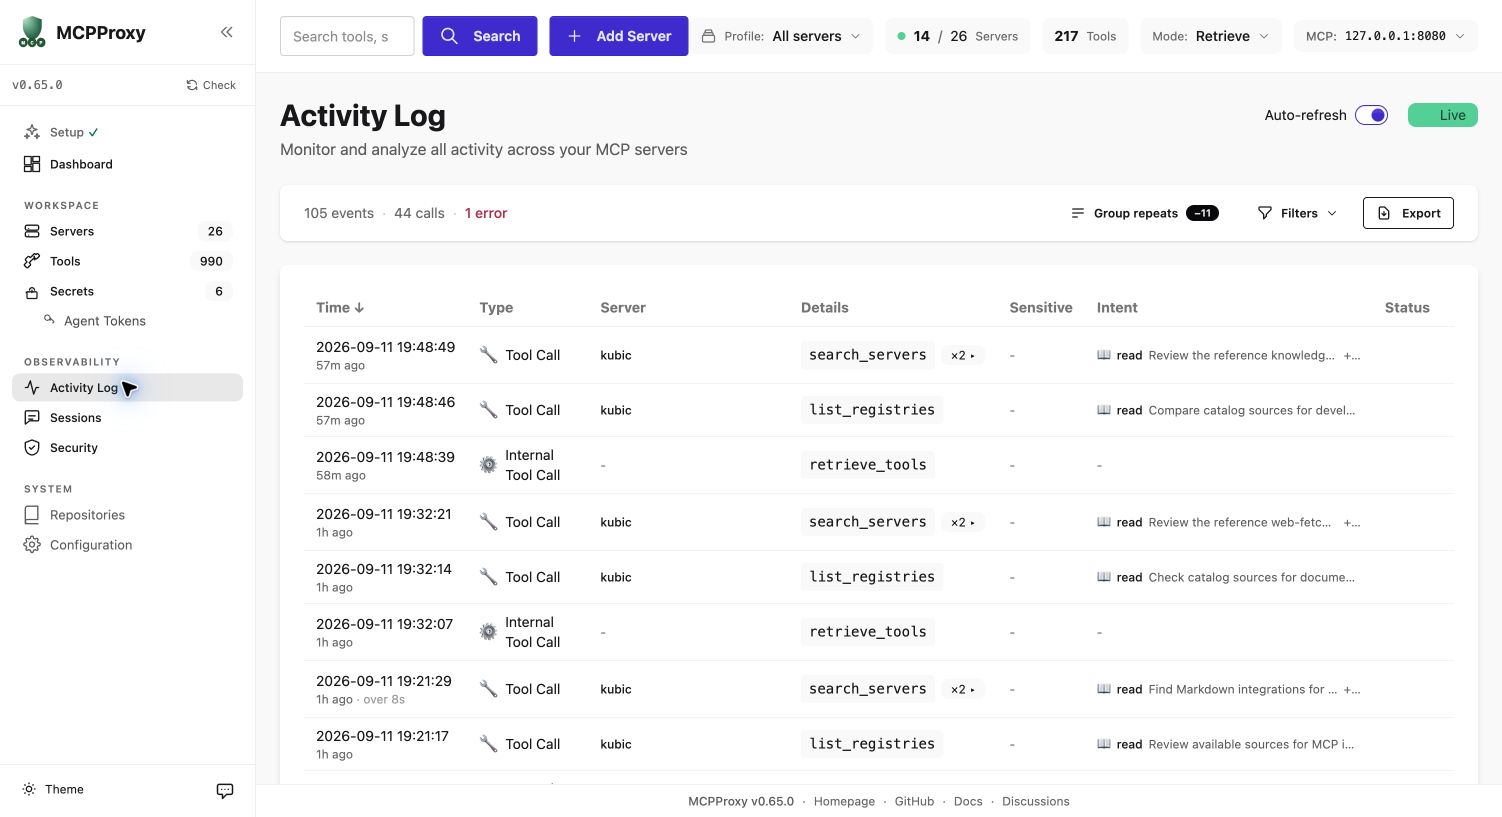
Read the intent behind a request and inspect its recorded outcome.
macOS menu bar
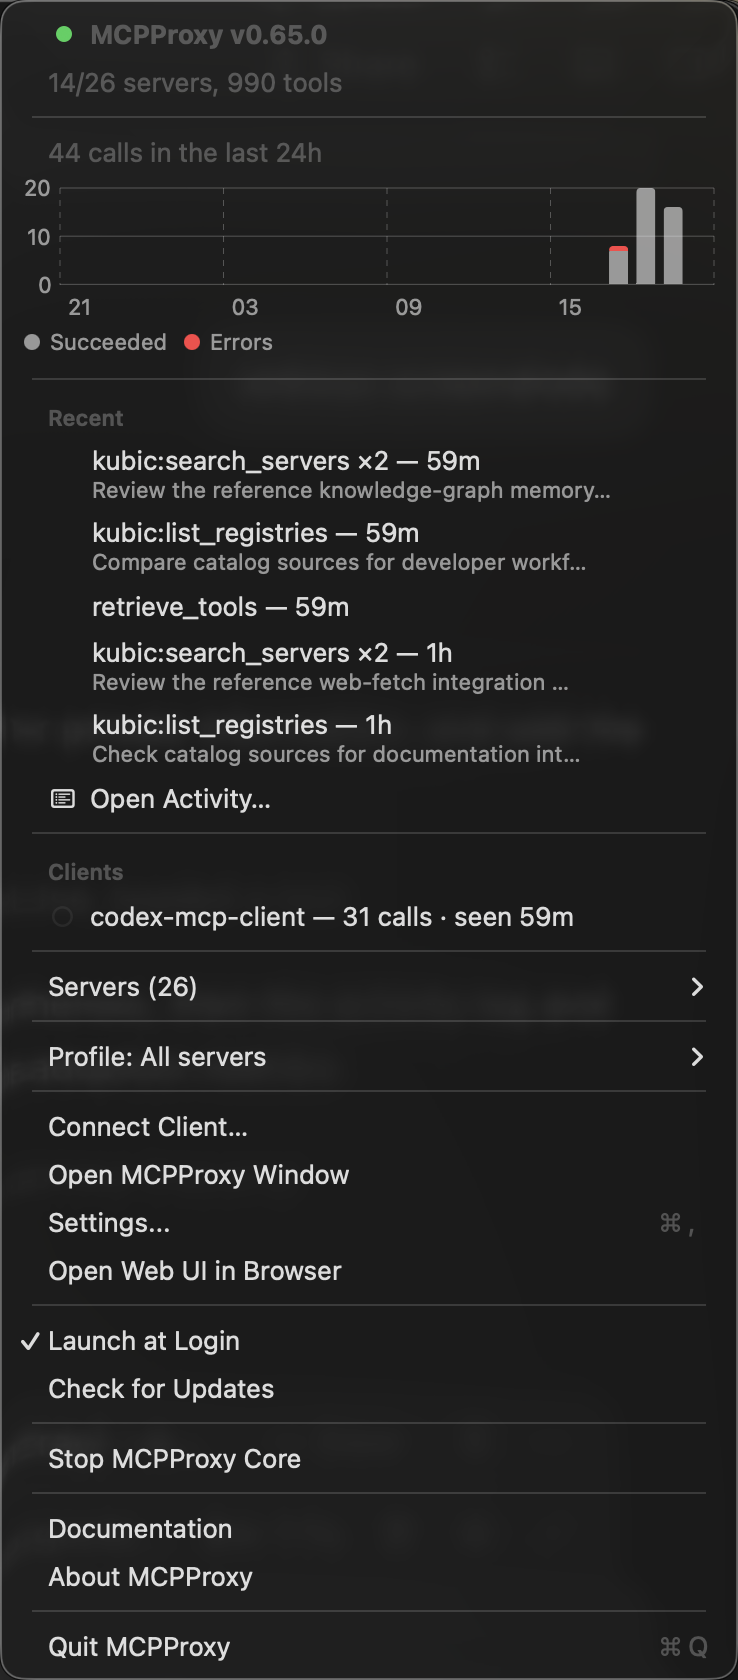
Open MCPProxy from the menu bar to see recent calls, their intents, connected clients and the last 24 hours of activity.
Server controls, profiles and the full Web UI are right there when you need them.
Actual tray menu—not the main app window. Recorded local activity includes demonstration calls.